The correlations also vary and they depend on the historical background,
scale, environment, market structure, and corporate structure.
It is
important to ascertain what it is that constitutes the foundation of the
economy.
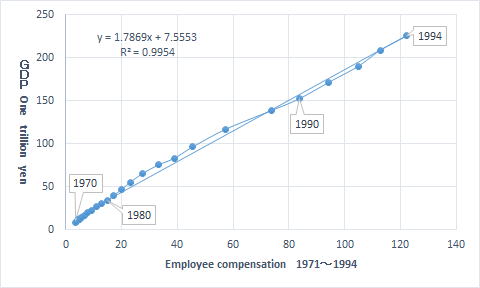
1970 to 1998
|
|
|
|
|
|
|
|
|
|
Employee
compensation |
Operating
surplus |
Gross domestic
product |
Private final
consumption expenditure |
Consumer price
index |
Sales |
|
Employee
compensation |
1.00 |
|
|
|
|
|
|
Operating
surplus |
0.96 |
1.00 |
|
|
|
|
|
Gross domestic
product |
1.00 |
0.97 |
1.00 |
|
|
|
|
Private final
consumption expenditure |
1.00 |
0.96 |
1.00 |
1.00 |
|
|
|
Consumer price
index |
0.96 |
0.95 |
0.96 |
0.96 |
1.00 |
|
|
Sales |
0.99 |
0.99 |
0.99 |
0.99 |
0.97 |
1.00 |
|
|
|
|
|
|
|
|
The
strong correlations that were seen from the 1970s into the 1980s such as those
between employee compensation and private final consumption expenditure,
between employee compensation and sales, between and among operating surplus,
consumer price index, private final consumption expenditure and sales, as well
as between and among gross domestic product, sales, private final consumption
expenditure and consumer price index, and between consumer price index and
sales have completely ceased to exist after 2000.
1994 to 2013
|
|
|
|
|
|
|
|
|
|
|
Employee compensation |
Operating surplus and mixed income |
Gross domestic product (production side) |
Private final consumption expenditure |
Price index |
Sales |
Operating profit |
|
Employee compensation |
1.00 |
|
|
|
|
|
|
|
Operating surplus and mixed income |
0.06 |
1.00 |
|
|
|
|
|
|
Gross domestic product (production side) |
0.82 |
0.56 |
1.00 |
|
|
|
|
|
Private final consumption expenditure |
-0.19 |
0.30 |
0.19 |
1.00 |
|
|
|
|
Price index |
0.82 |
-0.17 |
0.66 |
0.00 |
1.00 |
|
|
|
Sales |
0.15 |
0.41 |
0.42 |
0.22 |
0.07 |
1.00 |
|
|
Operating profit |
-0.41 |
0.64 |
0.01 |
0.52 |
-0.55 |
0.53 |
1.00 |
|
|
|
|
|
|
|
|
|
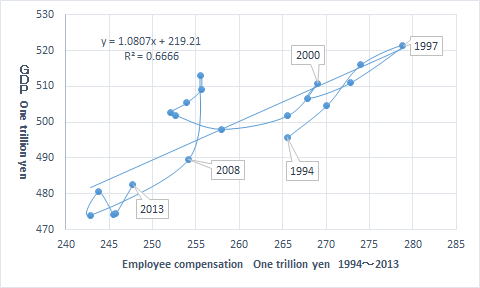
The economy is based on mutual relationships. If these mutual relationships
break down, the economy will not continue to function.
In other
words, economic indicators do not singly exist on their own.
They
indicate some sort of mutual relationship. These mutual relationships appear as
correlations.
To
examine these correlations, make the correlations rather than trying to find
the correlations. It is meaningful to create the correlations.
Losing
correlations degrades the economic policy and the rationality and consistency
of management. When the correlations between individual elements become weaker,
the context from economics and management will be lost.
The fact
that a correlation does not exist implies that the indicator based on the
correlation does not exist, and this means that conventional logic ceases to
apply.
Therefore,
if a correlation weakens, the indicator does not function properly.
If a
correlation does not exist, it means that the market after the collapse of the
bubble economy has fallen from its previous logical state into an illogical
space. When this happens, analysis based on conventional indicators becomes
meaningless.
1960 to 1979
|
|
|
|
|
|
|
|
|
|
Added value |
Taxes and dues |
Personal property and real estate expenses |
Interest paid |
Depreciation expenses |
Sales, general and administrative expenses |
|
Added value |
1.00 |
|
|
|
|
|
|
Taxes and dues |
1.00 |
1.00 |
|
|
|
|
|
Personal property and real estate rent |
1.00 |
0.99 |
1.00 |
|
|
|
|
Interest paid |
0.98 |
0.97 |
0.98 |
1.00 |
|
|
|
Depreciation expenses |
0.99 |
0.99 |
0.99 |
0.98 |
1.00 |
|
|
Sales, general and administrative expenses |
1.00 |
1.00 |
1.00 |
0.97 |
0.99 |
1.00 |
1980 to 1999
|
|
|
|
|
|
|
|
|
|
Added value |
Taxes and dues |
Personal property and real estate expenses |
Interest paid |
Depreciation expenses |
Sales, general and administrative expenses |
|
Added value |
1.00 |
|
|
|
|
|
|
Taxes and dues |
0.99 |
1.00 |
|
|
|
|
|
Personal property and real estate rent |
0.98 |
0.97 |
1.00 |
|
|
|
|
Interest paid |
0.28 |
0.31 |
0.15 |
1.00 |
|
|
|
Depreciation expenses |
0.99 |
0.98 |
0.99 |
0.22 |
1.00 |
|
|
Sales, general and administrative expenses |
0.99 |
0.98 |
0.99 |
0.19 |
1.00 |
1.00 |
|
|
|
|
|
|
|
|
2000 to 2013
|
|
|
|
|
|
|
|
|
|
Added value |
Taxes and dues |
Personal property and real estate expenses |
Interest paid |
Depreciation expenses |
Sales, general and administrative expenses |
|
Added value |
1.00 |
|
|
|
|
|
|
Taxes and dues |
0.47 |
1.00 |
|
|
|
|
|
Personal property and real estate rent |
0.21 |
0.02 |
1.00 |
|
|
|
|
Interest paid |
-0.22 |
0.22 |
-0.40 |
1.00 |
|
|
|
Depreciation expenses |
0.17 |
0.70 |
0.15 |
0.36 |
1.00 |
|
|
Sales, general and administrative expenses |
0.66 |
0.30 |
0.63 |
-0.15 |
0.25 |
1.00 |
What was
wrong with the bubble economy? The problem is that the correlations between the
elements that make up the market have been lost.
After
the collapse of the bubble economy, the correlations that had controlled the
market up to then have broken down.
The fact
that a correlation does not exist implies that the indicator based on the
correlation does not exist, and this means that conventional logic ceases to
apply.
In other
words, it means that the market after the collapse of the bubble economy has
fallen from its previous logical state into an illogical space. When this
happens, analysis based on conventional indicators becomes meaningless.
Correlations
are created in the market.
Unlike
physical phenomena, economic behavior must be done intentionally.
In other
words, it is natural that intentional acts exist. And that they can be adjusted
only through the will of humans. A harmonious result will not occur if they are
left alone. Put in another way, these are not random acts.
What is
important is the background that has been established by those indicators, and
the mechanisms that have been established. And what kind of functioning and
results are to be produced by changes to the assumptions of those mechanisms.
It is
necessary to confirm the assumptions that have established the indicators.
Among the assumptions that may be considered to have established the indicators
are the historical background, scale, industrial structure, systems, measures
and so on.
The
factors that change companies and the market are both internal and external
factors. The state of the economy is determined by where the internal factors
of companies and the market are, by what the external factors are at work on,
and by the correlations formed by these factors.
To
examine these correlations, make the correlations rather than trying to find
the correlations. It is meaningful to create the correlations.
The Copyright of these webpages including all the tables, figures and pictures belongs the author, Keiichirou Koyano.Don't reproduce any copyright withiout permission of the author.Thanks.
Copyright(C) 2017.6.6 Keiichirou Koyano